Data Driven Decisions with Value Gradients
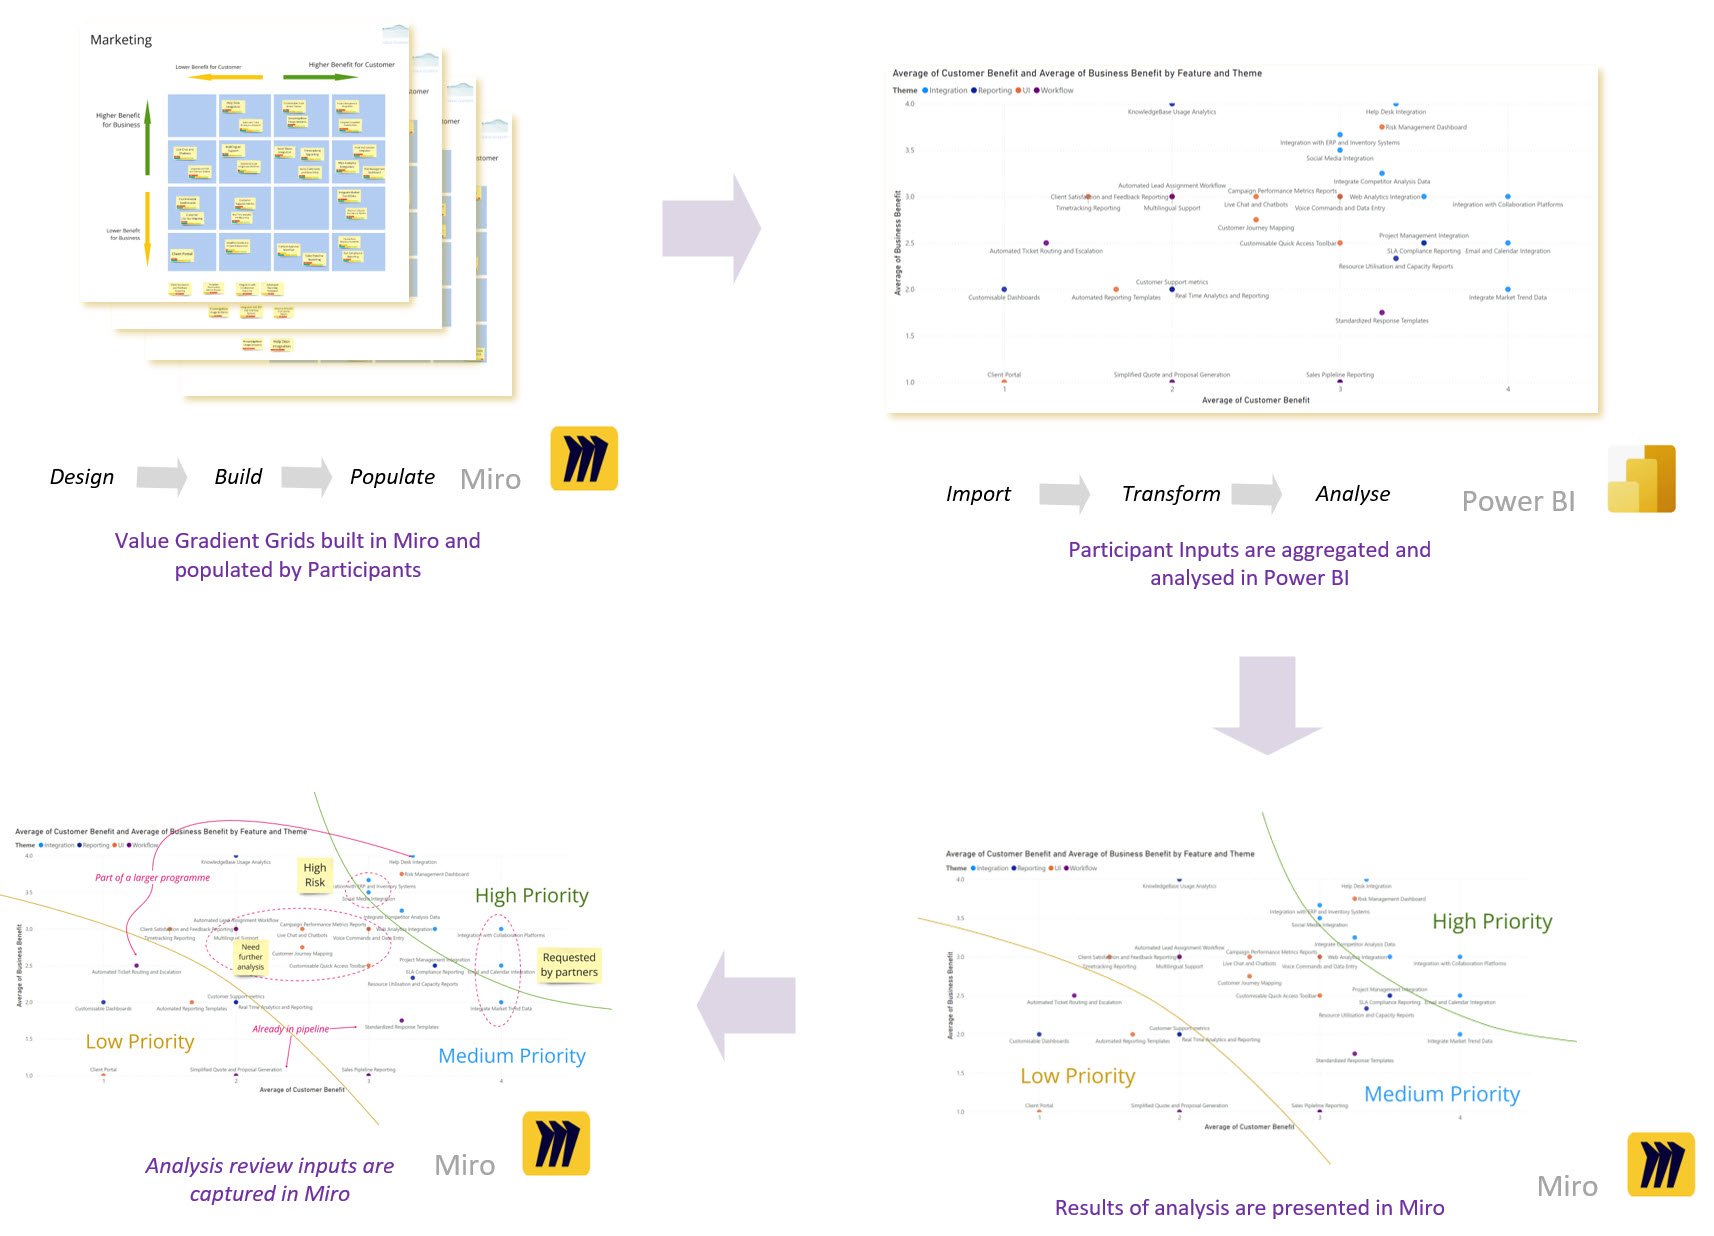
Design, build and refine Value Gradients using Miro and Power BI to drive Data Driven Decisions with complete Traceability
-
1. How to Build Value Gradients in Miro and facilitate participant engagement
-
1.1 Design a Value Gradient
What sort of scenarios call for a Value Gradient, which value types should you use and how big should the grid be.
-
1.2 Build data into your Value Gradient in Miro
Use Miro functionality to categorise the elements of your Value Gradient to enable subsequent data extraction.
-
1.3 Work with your audiences to populate the Value Gradient
Create Value Gradients for each audience with simple and clear directions then tag their inputs so they can be aggregated.
-
-
2. How to aggregate your participant inputs and analyse the results in Power BI
-
2.1 Import your participant inputs from Miro into Power BI
Bring the Value Gradient data from Miro and load it into Power BI.
-
2.2 Transform your data in Power BI
In order to use the Power BI Visual tools the uploaded data must be transformed in a series of simple steps.
-
2.3 Analyse your data in Power BI
Now use the Power BI Visualisation tools to present the aggregated data as a Value Gradient..
-
-
3. How to update the Value Gradient visual and facilitate Data Driven Decisions
-
3.1 Present the Value Gradient for further input
Use Miro to facilitate the presentation and review of the Value Gradient. Elicit further information and capture it in Miro.
-
3.2 Update the value gradient with additional information
Organise the additional information in Miro and upload it to Power BI where it is combined with the original inputs.
-
3.3 Bring the updated Value Gradient back into Miro to facilitate Data Driven Decisions
Use the Value Gradient to arrive at Data Driven Decisions. Each data element in the Value Gradient has full traceability back to the aggregated participant inputs.
-